Or how to keep from throwing yourself out a window over runtime constraint issues with just a few easy Xcode debugger console commands
Autolayout issues can be a pain. We’ve all seen those familiar error messages at runtime in our Xcode console, but hesitate to change anything in our storyboards or nibs, because seriously, who wants to open that can of worms? Well, here are a few simple tricks that might ease your reluctance to open those dreaded files, and hopefully also save you from digging endlessly through the IBHaystack to find the offending element.
Take a look at this typical example of a runtime constraint issue in Xcode:
2017-01-02 21:44:51.862311 RuntimeConstraintery[8234:130556] [LayoutConstraints] Unable to simultaneously satisfy constraints.
	Probably at least one of the constraints in the following list is one you don't want.
	Try this:
		(1) look at each constraint and try to figure out which you don't expect;
		(2) find the code that added the unwanted constraint or constraints and fix it.
(
    "<NSLayoutConstraint:0x60000009a090 UIView:0x7fceb4207b40.width == 1.87432*UIView:0x7fceb4207b40.height   (active)>",
    "<NSLayoutConstraint:0x60000009a450 UIView:0x7fceb4207b40.height == 150   (active)>",
    "<NSLayoutConstraint:0x6000000973e0 UIView:0x7fceb4207b40.trailing == UIView:0x7fceb1f0ecb0.trailing   (active)>",
    "<NSLayoutConstraint:0x60000009a950 UIView:0x7fceb4207b40.leading == UIView:0x7fceb4201750.leadingMargin   (active)>",
    "<NSLayoutConstraint:0x60000009a900 UIView:0x7fceb1f0ecb0.trailing == UIView:0x7fceb4201750.trailingMargin   (active)>",
    "<NSLayoutConstraint:0x600000099b90 'UIView-Encapsulated-Layout-Width' UIView:0x7fceb4201750.width == 414   (active)>"
)

Will attempt to recover by breaking constraint
<NSLayoutConstraint:0x60000009a450 UIView:0x7fceb4207b40.height == 150   (active)>

Make a symbolic breakpoint at UIViewAlertForUnsatisfiableConstraints to catch this in the debugger.
The methods in the UIConstraintBasedLayoutDebugging category on UIView listed in <UIKit/UIView.h> may also be helpful.
Runtime constraint issues are marked with the keyword [LayoutConstraints], and can give you lots of useful information if you read between the lines. For instance, from the above example we know we are most likely looking for a UIView with a height constant of 150. However, if that doesn’t exactly narrow it down for you, copy and paste your error into a text editor for reference, and continue to step 1.
1. Set a symbolic breakpoint for UIViewAlertForUnsatisfiableConstraints
Apple helps you out by supplying your first step right in the body of the error message. Set a symbolic breakpoint, like so:
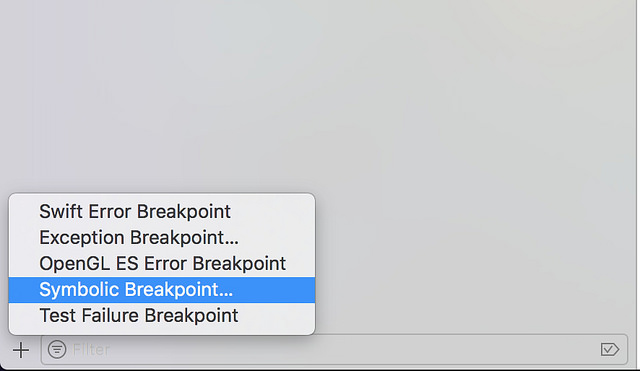
In the breakpoint panel in Xcode, add a new symbolic breakpoint.
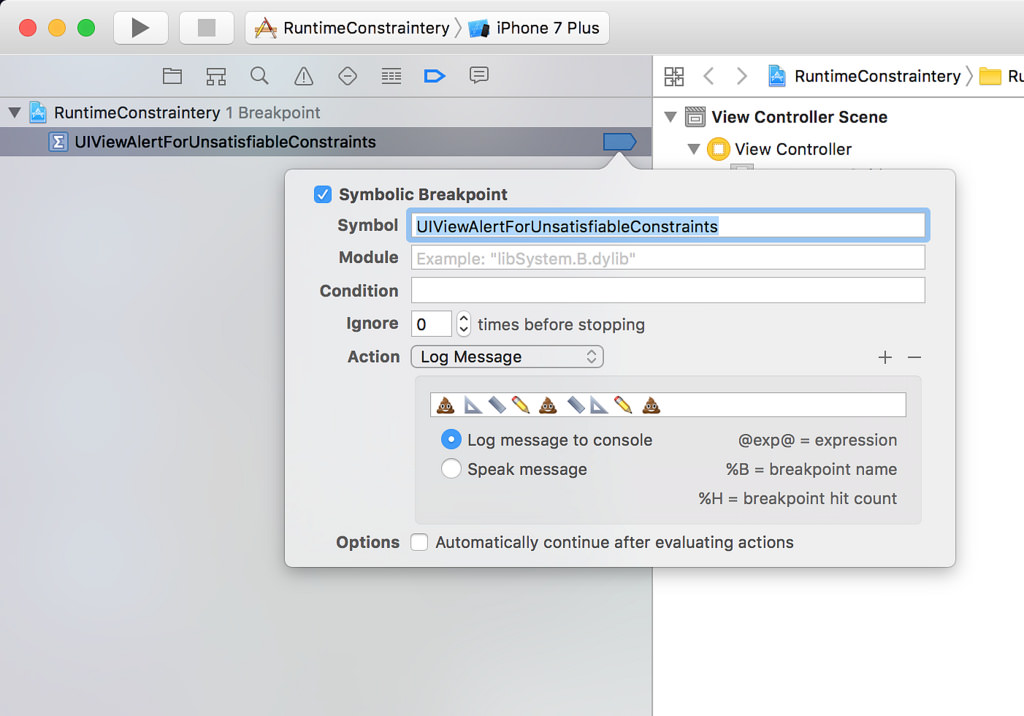
Assign the symbol as ‘UIViewAlertForUnsatisfiableConstraints’, and supply it with an attention-grabbing log message.
2. When you hit the breakpoint, trace the autolayout stack
Paste the following command into your Xcode console:
expr -l objc++ -O -- [[UIWindow keyWindow] _autolayoutTrace]
This will give you a full hierarchal printout of all autolayout objects that are currently on screen. Inspect these results. Look for keywords like “AMBIGUOUS LAYOUT”, but bear in mind that this won’t necessarily point you directly to the element in question. However, it will most likely help you find it. You might also want to take a look at your view hierarchy, as your issue may be happening on a view that is hiding somewhere in the background, unbeknownst to frustrated programmers. You can print your view hierarchy with this command:
expr -l objc++ -O -- [[[UIWindow keyWindow] rootViewController] _printHierarchy]
Compare your results to the original error message you pasted in your text editor before. Starting to find any clues? If not, don’t worry. All is not lost.
3. Get a more detailed description
Using memory addresses supplied in step 2, you can get all the information you need about the element(s) in question, using these console commands:
po MEMORY_ADDRESS
(prints a basic description of the element)
- OR…
po [MEMORY_ADDRESS recursiveDescription]
(prints a slightly more in-depth description of the element)
- OR…
po [[MEMORY_ADDRESS superview] recursiveDescription]
(prints WAY more about the element than you’ll ever needed to know)
4. Get some visual feedback
If you still haven’t found your bad element (hey, it happens), there’s one more thing that might help: embarrass it.
First, import UIKit into the debugger console so you can access the UIColor library:
expr -l Swift -- import UIKit
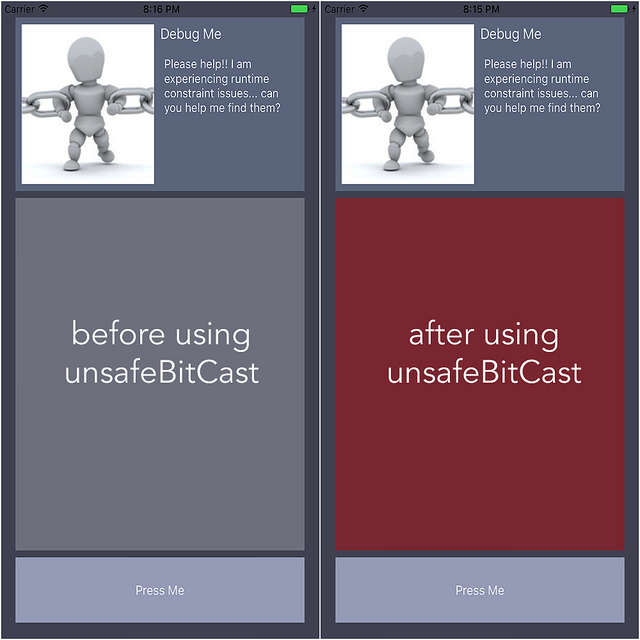
Then, turn the guilty element red with embarrassment:
expr -l Swift -- unsafeBitCast(MEMORY_ADDRESS, to: UIView.self).backgroundColor = UIColor.red
Finally, continue past the breakpoint to view the effect.
An example of the resulting effect:
Conclusion
Once you’ve found the constraint(s) in question, the simplest solution is usually to lower the priority slowly, running the app after each change. Hopefully these tricks will help you find your culprit, and keep you from causing physical harm to your computer.
comments powered by Disqus